BlueSel Commercial Solar Blog
Click here to see the full graphic
Solar Energy Milestone in New England
A Solar Energy Production Peak in 2018
Every homeowner and business wants steady, uninterrupted electricity. A stable and resilient power supply network to make this happen is a challenge. On any given day, there is a wide diversity in demand. If power on the network doesn’t match the demand at any moment, the results are usually noticeable. Everyone experiences light flickering as a symptom. When mismatches are worse, there could be short brownouts.
From power plant operations to energy transmission and distribution management, every party that manages a piece of the supply must be ready. They cannot just be reactive. Planning and forecasting is a large part of the task in keeping the network stable. Teams of people are looking at hour ahead needs, and all the way up to 2 and 3 years out.
As operators look ahead to predict the need to increase or decrease supply levels throughout the grid, they have limited options. Energy may be redirected in some cases. Dispatchable generating plants – or ones that can be scaled up or down relatively quickly – are usually cycled as first option.
With the growth of solar power, many utilities have modified their forecasting and planning. Solar peaks and demand peaks fluctuate differently during the day. Having more flexibility in using the existing dispatchable capacity is a big deal.

A Historic Solar Energy Event
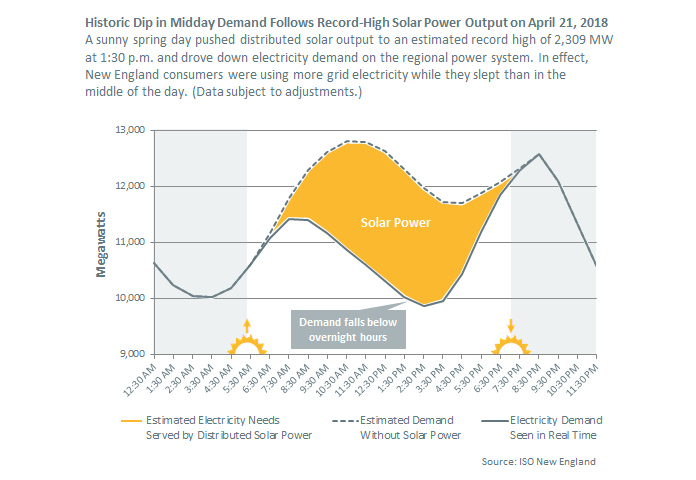
On April 21, 2018, something happened within the New England power grid for the first time. The mix of electricity demand and solar energy production made history. The midday peak energy demand from the power grid was lower than at the lowest point overnight. The nighttime demand wasn’t higher than usual. The reason for this historic first is the effectiveness of energy efficiency and the combined output of 130,000 small, medium and large solar installations in New England. The capacity of off-the-grid solar installations in New England — mostly rooftop solar panels — has grown almost tenfold since 2012, to more than 2,500 megawatts (MW).
Solar power’s ability to drive grid-scale reductions in demand was expected: The capacity of off-the-grid solar installations in New England — mostly rooftop solar panels — has grown almost tenfold since 2012, to 2,400 megawatts. Roughly speaking, that’s enough to power almost 2 million homes — when the sun is shining.
There are a number of reasons why this is an important solar power milestone. Two of the more important reasons are:
This is tangible evidence of the changing nature of power supply within the ISO New England territory. On the sunniest of days, the existing dispatchable plants are least needed. This also gives planners more flexibility to keep the grid stable. With more idle plant capacity, the first plants to be scaled up can be the cheapest to operate. Of course, the more they are idle or running at reduced capacity, the less fuel they burn and the consequences of those emissions are lowered.
The debates about expanding fossil fueled generating capacity, natural gas pipelines, importing more hydropower from Quebec, etc., are all now changed as more local solar energy generating capacity slows down those needs. To be fair, the debate about how to best prepare dispatchable capacity for the future is changing, too.
Adding a solar energy system to your business or organization is a quick way to realize immediate savings as well as 25+ years of reducing or eliminating reliance on your utility. And with each new commercial solar installation, the chances of the next historic solar energy event grow. Soon we might see successive days where daytime gird demand is lower than overnight demand.
We encourage you to take a serious look at solar for your location. Simply request a free evaluation and we will provide you with a summary of options.

More Details: About the Solar Energy Duck Curves (above)
People who are immersed daily in the solar energy market have been introduced to what has been labeled the “duck curve”. Utilities have long plotted the energy demand and power generation levels each day, week, month, and over longer periods. As more renewable energy is added, and especially solar energy, a unique shape appears almost regularly. As the sun begins to set, the levels of solar energy production lessen. Energy demands are often still at or near daily peaks. So the grid power supply curve bends upwards in the late afternoon and early evening. The nominal shape has earned the name of “duck curve”.
This phenomena first because obvious and repeated in California as early as 2012 and 2013. The local April 21 event marks the first time we could say New England is “catching up” with California. And if you look closely at the shape of the above visual from ISO New England, you see the point where the difference between solar generation, and grid power demand resulted in the “belly of the duck” being lower than the previous night’s lowest demand. From about 1:30 PM to about 3:30 PM history was made.
About ISO New England
ISO New England is responsible for power markets and grid operations that extend across Connecticut, Maine, Massachusetts, New Hampshire, Rhode Island and Vermont.
It is officially defined as an independent, non-profit Regional Transmission Organization (RTO), headquartered in Holyoke, Massachusetts. An RTO is an electric power transmission system operator (TSO) which coordinates, controls and monitors a multi-state electric grid.